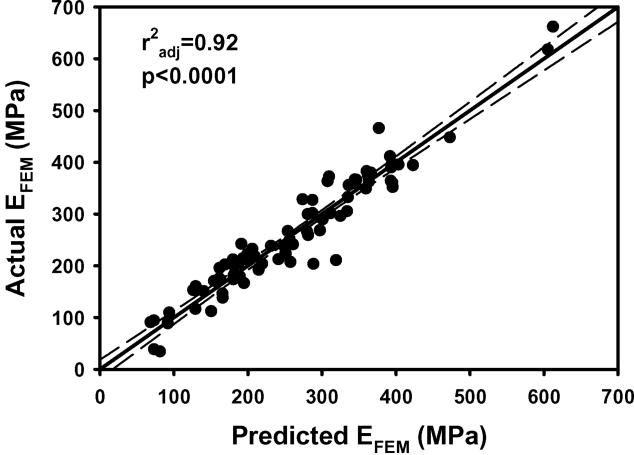
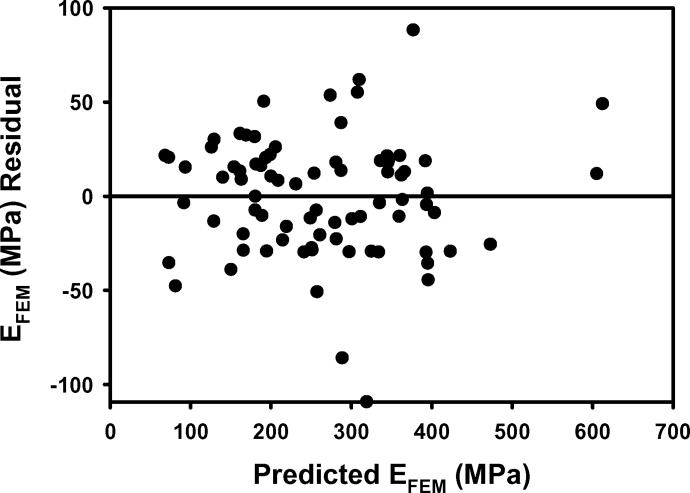
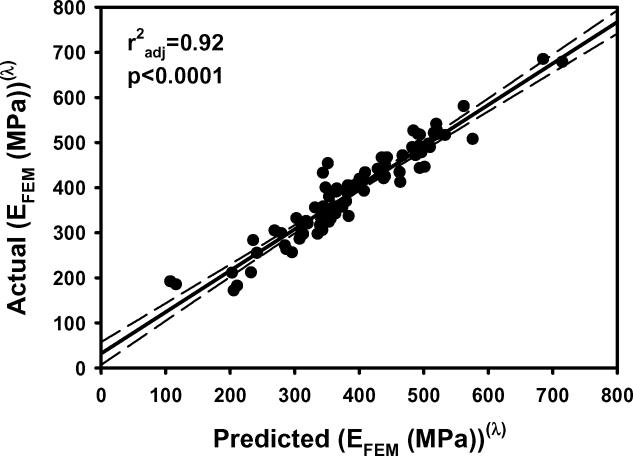
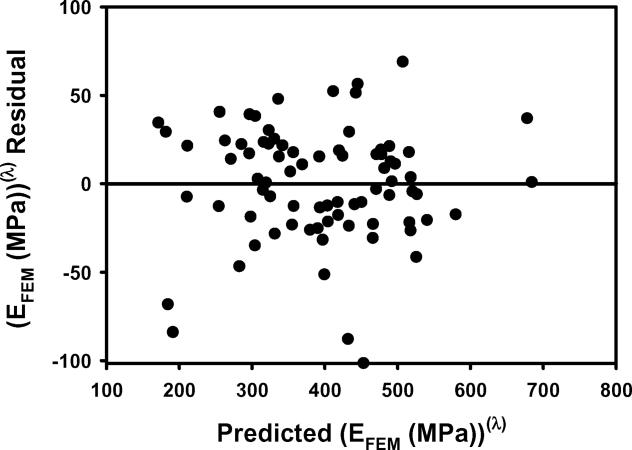
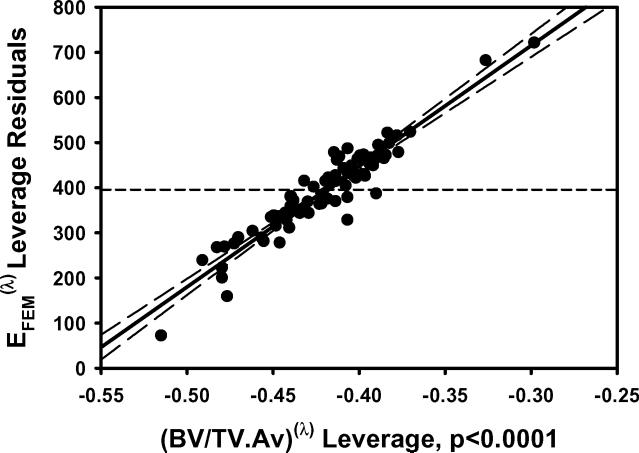
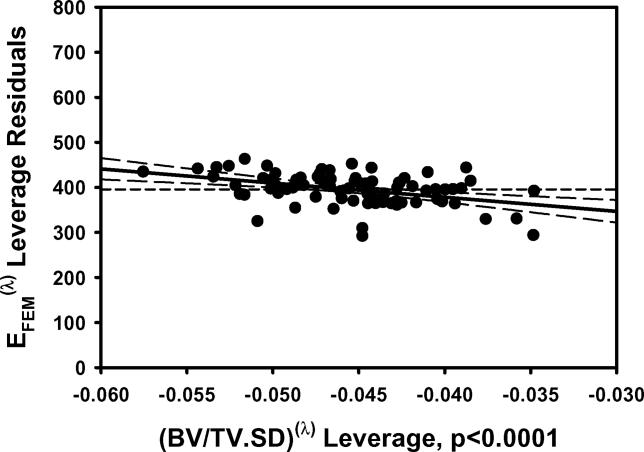
Figure 1.
a) EFEM calculated from finite element models vs EFEM predicted by the multiple regression model including BV/TV.Av and BV/TV.SD using nontransformed variables. b) The residuals for the model with nontransformed variables. c) As in 1a except using transformed variables. d) The residuals for the model with transformed variables. e) Leverage plot for BV/TV.Av and f) Leverage plot for BV/TV.SD. Solid, medium dashed and small dashed lines show linear fits, 95% confidence intervals and mean of the actual EFEM, respectively. (95% confidence curve crossing the mean response line indicates a significant leverage for the effect.) The model with transformed variables and that with nontransformed variables were qualitatively similar.

