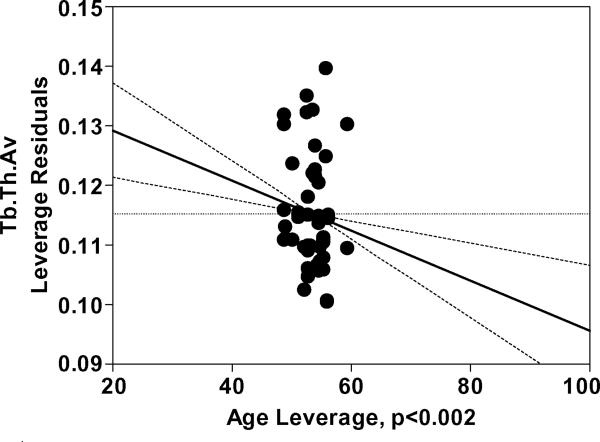
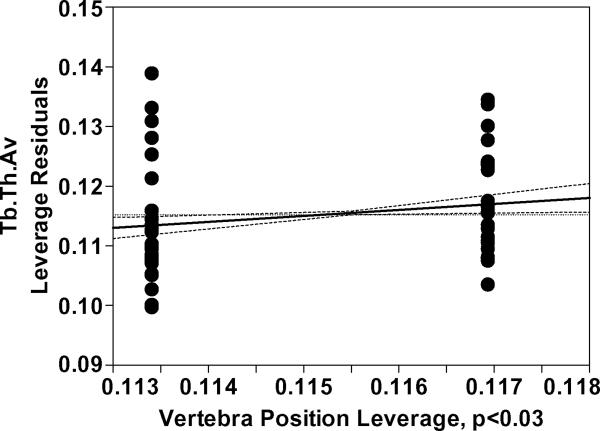
Figure 3.
a) Age leverage and b) Vertebra leverage plots for the reduced Tb.Th.Av model for females, constructed based on significant interactions found between age and gender in the main model (Table 4). The increasing direction of vertebra leverage is from T12 to L1. The results show a decrease in Tb.Th.Av with increasing age and a greater Tb.Th.Av in L1 than in T12 for females. The age and vertebra effects were nonsignificant (p>0.4 and p>0.8, respectively) in the model for males.


