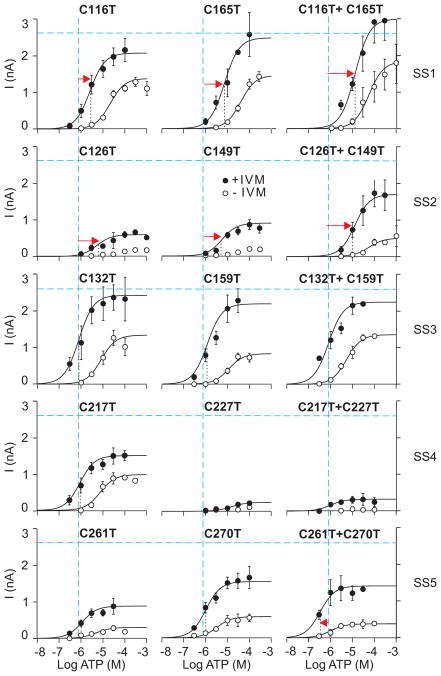
Fig. 3.
ATP dose-response curves for single and double threonine mutants of P2X4R. Concentration dependence of ATP on the peak current amplitude responses in single-point mutants (left and middle panels) and double mutants (right panels) for five disulfide bonds is shown in the absence (open circles) and presence (closed circles) of 3 μM IVM. Each row shows paired cysteine mutants that form disulfide bonds (SS1-5). Vertical and horizontal dashed lines (in blue) indicate the EC50 and Imax values, respectively, for P2X4R-WT in the presence of 3 μM IVM. The vertical dotted lines (in black) represent the mean EC50 values for T-mutants in the presence of IVM and significant shifts (red arrows). Data shown are mean ± SEM from 6–30 cells.

