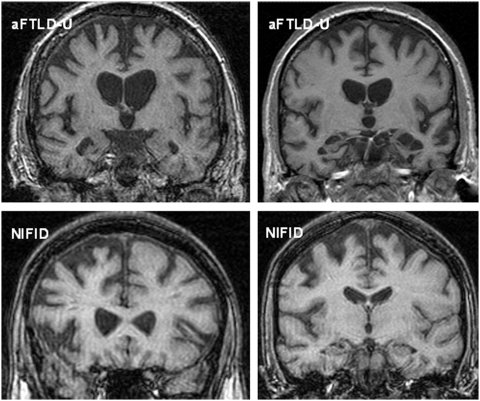
Figure 1.
Representative magnetic resonance coronal T1 images of cases with atypical FTLD-U (Top left aFTLD-U6; Top right aFTLD-U3) and NIFID (both images from NIFID1). Top left: the magnetic resonance image shows asymmetrical right greater than left frontotemporal atrophy; Top right: the magnetic resonance image shows asymmetrical left greater than right frontotemporal atrophy. The images on the bottom row are from the same patient and show asymmetrical fronto-insular atrophy.

