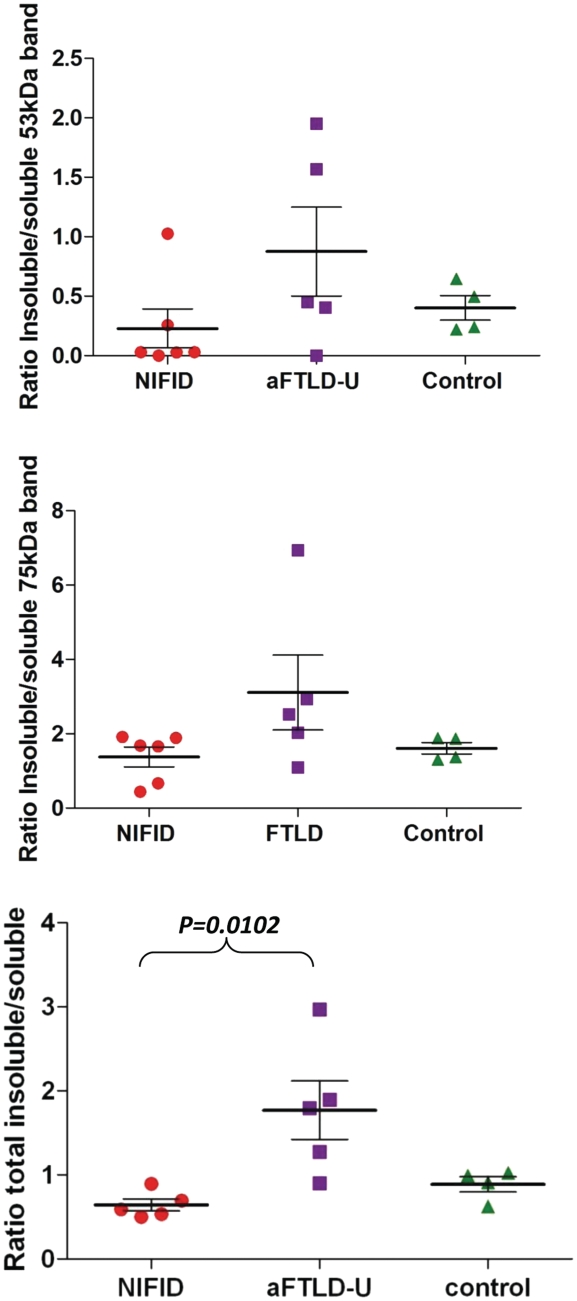
Figure 7.
Ratio of insoluble to soluble FUS. The band intensities of FUS in insoluble (SDS and urea soluble) and soluble (PBS soluble) fractions were analysed and a ratio calculated in each case. Bands visible at both ∼53 and ∼75 kDa were analysed individually and combined to calculate the ratios of total FUS. The ratios are illustrated on the plot with each point representing a case and the solid line representing the mean. Although there is some overlap between the two disease types, the atypical FTLD-U group showed significantly higher ratios compared with both the NIFID and control group when total FUS was analysed (one way Kruskal–Wallis test; P = 0.01).

