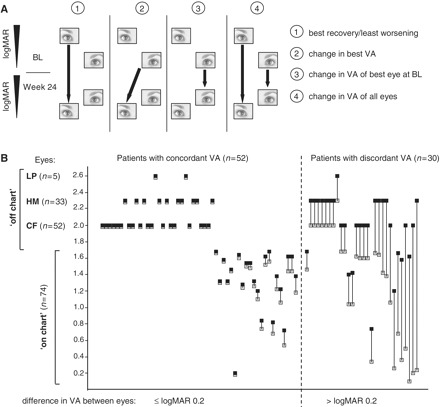
Figure 1.

(A) Visual acuity efficacy end-points (filled arrows) between baseline and Week 24. (1) Primary end-point—best recovery/least worsening in visual acuity, one value per patient. (2) Main secondary end-point—change in best visual acuity, one value per patient. (3) Pre-specified secondary end-point—change in visual acuity of best eye at baseline, one value per patient. (4) Pre-specified secondary end-point—change in visual acuity of all eyes (both eyes of a patient considered independent), two values per patient. (B) Visual acuity at baseline for all patients. Both eyes are shown for each subject, connected by a solid line (grey squares = eye with better visual acuity; black squares = eye with worse visual acuity). BL = baseline; CF = finger counting; HM = hand motion; LP = light perception; VA = visual acuity.
