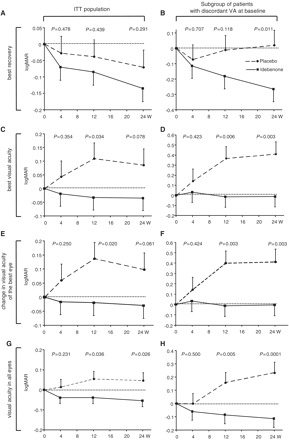
Figure 2.

Change in visual acuity (logMAR) end-points over time for the change in best recovery of visual acuity (A and B), change in best visual acuity (C and D), change in visual acuity of the patients’ best eye at baseline (E and F) and change in visual acuity for all eyes (G and H). For each analysis two populations are presented: the whole study population (n = 82, intent-to-treat population for visual acuity end-points) (A, C, E and G) and subpopulation of patients with discordant visual acuities at baseline (n = 30, B, D, F and H). Filled squares/solid line = idebenone group; filled circles/dashed lines = placebo group, P-values for comparison between idebenone and placebo groups. Data are estimated means (±SEM) from mixed model for repeat measures based on the change from baseline. ITT = intent-to-treat; VA = visual acuity; W = weeks.
