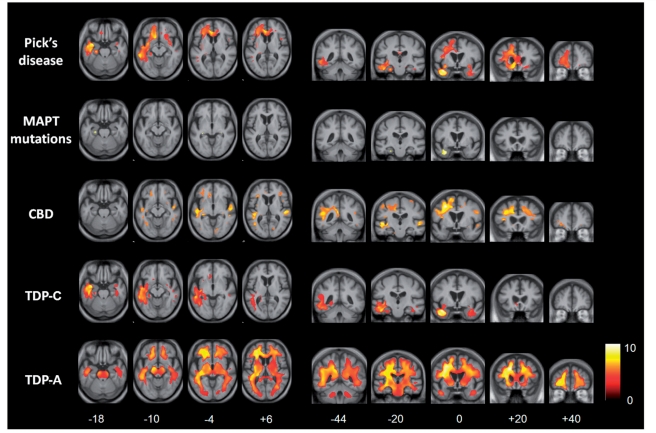
Figure 3.
Voxel-based morphometry analysis on white matter regions in FTLD pathological groups relative to healthy controls. Statistical parametric maps have been thresholded at P < 0.01 after false discovery rate correction over the whole-brain volume and rendered on axial (left) and coronal (right) sections of a study-specific average group T1-weighted MRI template image in DARTEL space. The colour bar (lower right) indicates the t-score. This analysis was performed on flipped images (see text). For ease of comparison, the same brain template sections are shown for each pathological group; co-ordinates (mm) for the plane of each section are indicated below. CBD = corticobasal degeneration.

