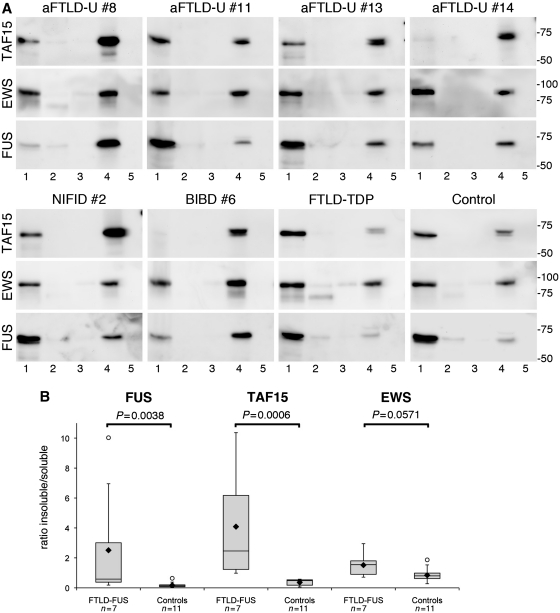
Figure 6.
Biochemical analysis of FET proteins in FTLD-FUS. (A) Proteins were sequentially extracted from frontal cortex of atypical FTLD-U, NIFID, BIBD, normal as well as neurological controls. High salt (Lane 1), Triton-X-100 (Lane 2), radioimmunoprecipitation assay buffer (Lane 3), 2% sodium dodecyl sulphate (Lane 4) and formic acid (Lane 5) protein fractions were separated by sodium dodecyl sulphate–polyacrylamide gel electrophoresis and immunoblotted with anti-TAF15 (TAF15-309A), EWS (G5) and FUS (FUS-302A). All proteins were present in the soluble high salt fraction and sodium dodecyl sulphate fraction in each case as one major band at the expected molecular size for the full-length proteins. However, the amount of TAF15 and FUS in the sodium dodecyl sulphate fraction was much higher in FTLD-FUS compared with controls, while the shift towards the sodium dodecyl sulphate fraction was less obvious for EWS. (B) Densitometric quantification of band intensities of FUS, TAF15 and EWS in the soluble (high salt) and insoluble (sodium dodecyl sulphate) fraction was performed. Calculated insoluble/soluble ratios for each protein in the FTLD-FUS (n = 7) and control group (n = 11, including four normal controls, five FTLD with TDP-43 pathology and two cases with Alzheimer’s disease) are shown as box plot showing the range of values, with the box being subdivided by the median into the 25th and 75th percentiles. Filled rhombus represents the mean; circles represent outliers. aFTLD-U = atypical FTLD-U.

