
Figure 2.
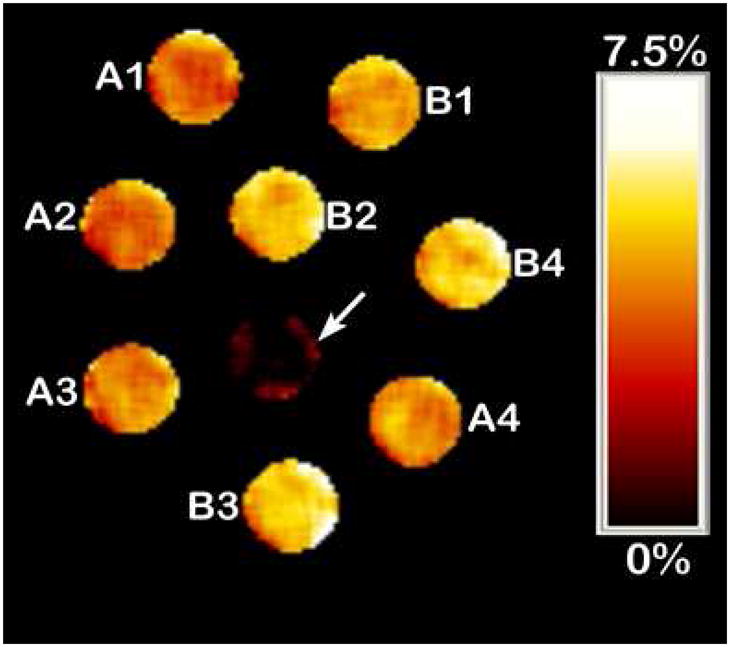
CEST images of phantoms on a MRI 4.7 Tesla Scanner. Arrow: buffer only, other samples contain [Fe(L1)]3+: A1 (pH 6.8, 2 mM), A2, (pH 6.8, 3 mM), A3 (pH 6.7 6 mM), A4 (pH 6.8, 8 mM), B1 (pH 7.2, 2 mM) B2 (pH 7.2, 3 mM), B3 (pH 7.1, 6 mM), B4 (pH 7.1, 8 mM) at 37 °C, with 20 mM Hepes and 100 mM NaCl. Scale represents loss of signal due to CEST saturation pulse.