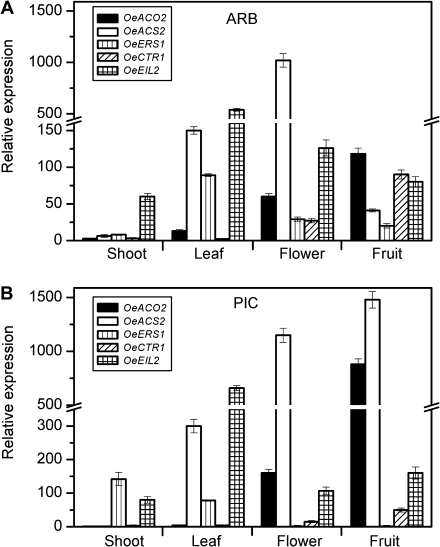
Fig. 2.
Expression of different components of the ET synthesis and signalling pathways in various olive tissues. Real-time PCR was used to analyse the expression patterns of OeACS2, OeACO2, OeERS1, OeCTR1, and OeEIL2. Each value represents the means ±SE of three replicates. Relative expression values were normalized to the lowest expression value taken as 1.

