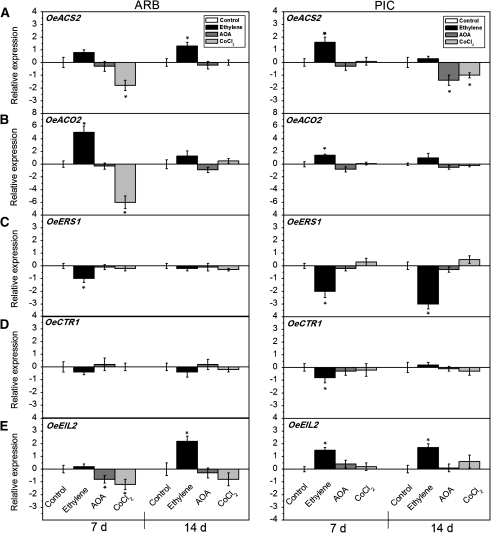
Fig. 5.
Expression of OeACS2 (A), OeACO2 (B), OeERS1 (C), OeCTR1 (D), and OeEIL2 (E) in olive fruit AZ–AC of ARB and PIC cultivars treated with water (control), 10 mM ethephon (exogenous ethylene), 10 mM aminooxyacetic acid (AOA), or 10 mM cobalt chloride (CoCl2) at 7 d and 14 d after treatment. The histograms represent the average data from three replications using real-time PCR analysis, with the control set at 0. Error bars indicate SEs from three replicates. Asterisks above the bars indicate values that were determined by the t-test to be significantly different (P <0.05) from control.

