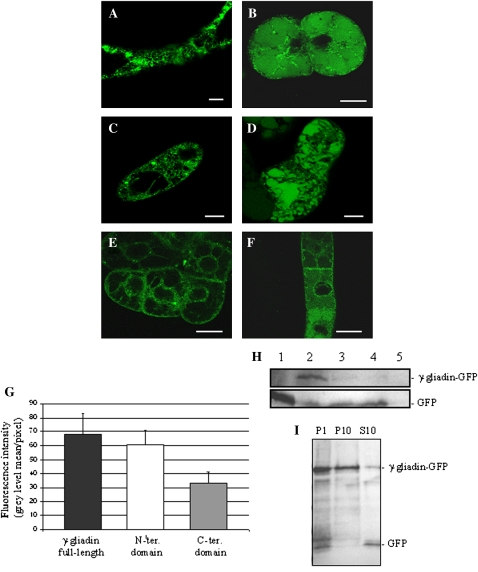
Fig. 7.
The subcellular localization of γ-gliadin and domain fusions to GFP in stable transgenic BY-2 cells. (A and B) Subcellular localization of full-length γ-gliadin–GFP expressed in BY-2 cells 3 d (A) or 6 d (B) after subculturing. (C and D) Subcellular localization of N-ter-γ-gliadin–GFP expressed in BY-2 cells 3 d (C) or 6 d (D) after subculturing. (E and F) Subcellular localization of Cter-γ-gliadin–GFP expressed in BY-2 cells 3 d (E) or 6 d (F) after subculturing. Scale bars=20 μm. (G) Fluorescence intensity quantification from BY-2 cells expressing the fusion proteins. Fluorescence intensities were measured from confocal images of BY-2 cells expressing full-length γ-gliadin–GFP, Nter-γ-gliadin–GFP, or Cter-γ-gliadin–GFP proteins. They are expressed as the mean grey level per pixel. (H) An immunoblot was performed with anti-GFP antibodies. (1) Protein extract of YFP expressed in E. coli as a positive control; (2) 4-day-old BY-2 cells expressing γ-gliadin–GFP; (3) 6-day-old BY-2 cells expressing γ-gliadin–GFP; (4) 10-day-old BY-2 cells expressing γ-gliadin–GFP; (5) non-transformed BY-2 cells as a negative control. (I) Immunoblotting performed with an anti-GFP antibody from 4-day-old BY-2 cells expressing γ-gliadin–GFP homogenate subjected to differential centrifugation as previously described (Tamura et al., 2004). P1, pellet fraction after a 1000 g centrifugation of the homogenate; P10, pellet fraction after a 10 000 g centrifugation of the S1 supernatant; S10, 10 000 g supernatant.

