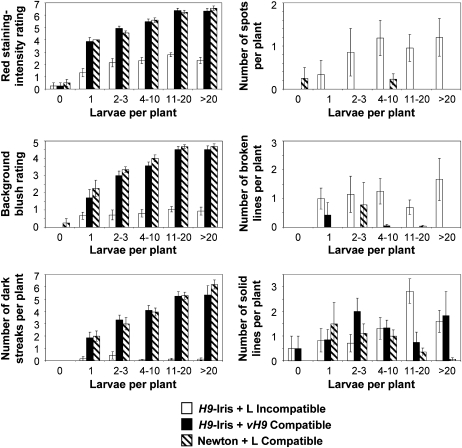
Fig. 2.
Effect of the infestation level on rating of six characters associated with permeability. Leaf 3 was stained 3 DAH. The same data set for 212 plants from 16 infestation level groups were analysed in Fig. 2, Fig. 3, and Table 1. Univariant comparisons utilized unpaired Student's t-test analysis. Characteristics of neutral red stain absorption were either rated (red staining intensity rating scale from 0 to 7 and background blush rating scale from 0 to 5) or counted (number of dark streaks, spots, broken lines, and solid lines) and then averaged for plants undergoing varying levels of infestation (larvae per plant). Examples of staining intensities in the rating scale are shown in Fig. 1, with ratings of ‘0’ representing plants with no absorbed stain and ratings of ‘7’ (red staining-intensity rating) and ‘5’ (background blush rating) representing plants stained the darkest. White bars correspond to characteristic averages for resistant H9-Iris infested with Biotype L larvae (incompatible). Black bars correspond to susceptible H9-Iris infested with vH9 larvae (compatible). Striped bars correspond to susceptible Newton infested with Biotype L larvae (compatible). Standard error of the mean analysis is shown.

