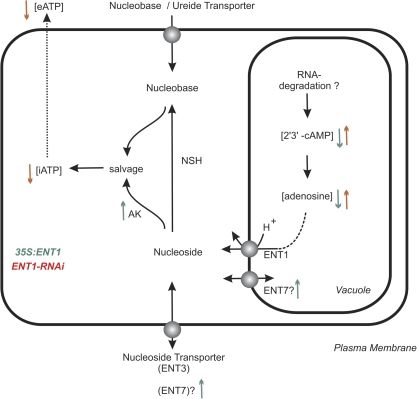
Fig. 8.
Model explaining the cellular alterations in ENT1 mutants. Arrows indicate up- or down-regulated enzyme activities (AK), transcript levels (ENT7) or metabolite concentrations. Colours indicate whether the measurements were obtained on 35S:ENT1 mutants relative to WT (green) or ENT1-RNAi mutants relative to WT (red). ENT7 appears at the plasmamembrane and the tonoplast as the subcellular localization has not been clarified. AK, adenosine kinase; NSH, nucleoside hydrolase; iATP, internal ATP; eATP, external ATP. (This figure is available in colour at JXB online.)

