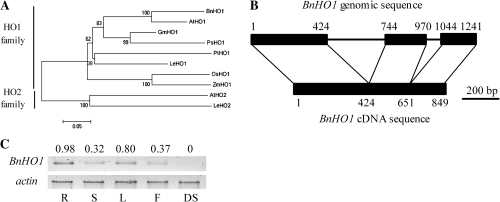
Fig. 2.
Phylogenetic properties, structure, and expression pattern of BnHO1. The phylogenetic tree of corresponding mature HO-1/2 proteins in plants (A). Database accession numbers are shown in Fig. 1. The NJ tree was constructed with MEGA 4.0. The scale bar corresponds to 0.05 estimated amino acid substitutions per site. Diagrammatic alignment of the genomic DNA and cDNA sequences of BnHO1 indicating the location of intron–exon boundaries (B). Black boxes and lines denote coding regions and introns, respectively. Numbers refer to the first and last nucleotides of the exons, respectively. This illustration is drawn to scale. mRNA expression of BnHO1 (C) in roots (R), stems (S), leaves (L), flowers (F), and dry seeds (DS). The actin amplification band is shown to confirm equal loading of RNA and RT efficiency. The PCR products were run on 1.2% agarose gel and visualized under UV light. The number above the band indicates relative abundance of the corresponding gene with respect to the loading control actin.

