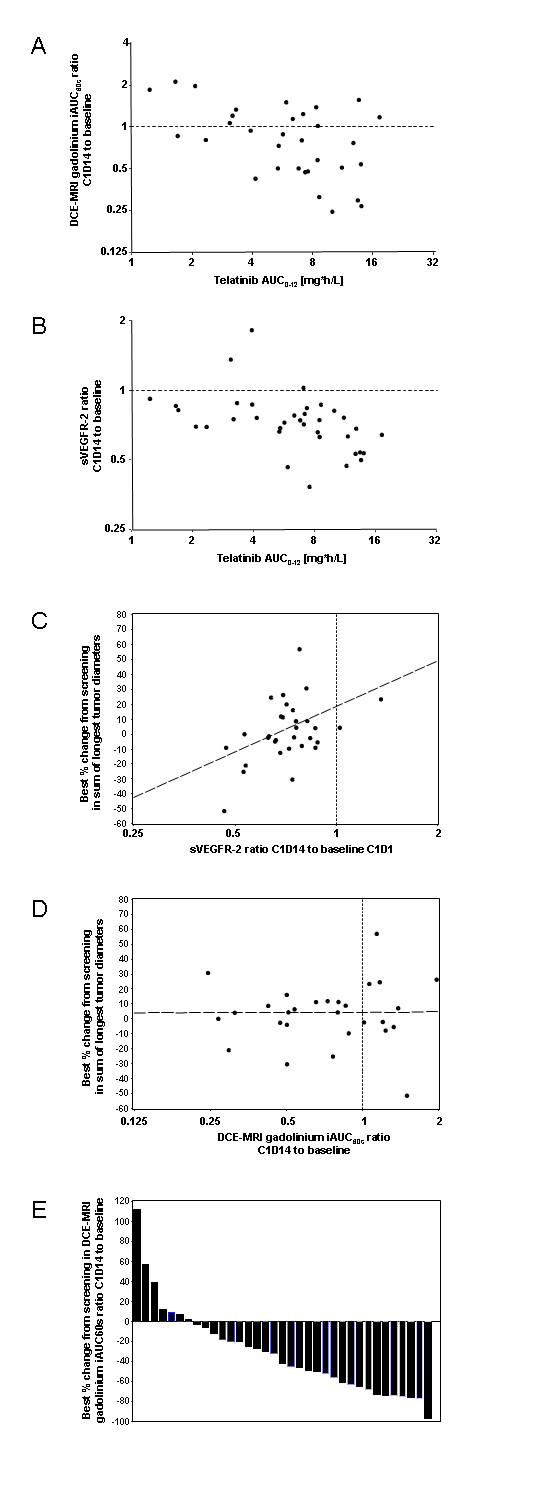
Figure 2.

Biomarkers, PK/PD. Analysis of telatinib AUC(0-12) on day 14 of cycle 1 versus the ratio of the initial 60 second area under the gadolinium curve (iAUC60) on day 14 of cycle 1 to the iAUC60 at baseline [A] and versus the ratio of sVEGFR-2 in plasma on day 14 of cycle 1 to sVEGFR-2 at baseline [B]; correlation of ratio of sVEGFR-2 in plasma on day 14 of cycle 1 to sVEGFR-2 at baseline to best % change from screening in sum of longest tumor diameters [C]; correlation of ratio of the DCE-MRI initial 60 second area under the gadolinium curve (iAUC60) on day 14 of cycle 1 to the iAUC60 at baseline to best percent change from screening in sum of longest tumor diameters [D]. Best percent change of the DCE-MRI initial 60 second area under the gadolinium curve (iAUC60) from screening compared to day 35 or any day later during study treatment. Each column is representing 1 patient [E].
