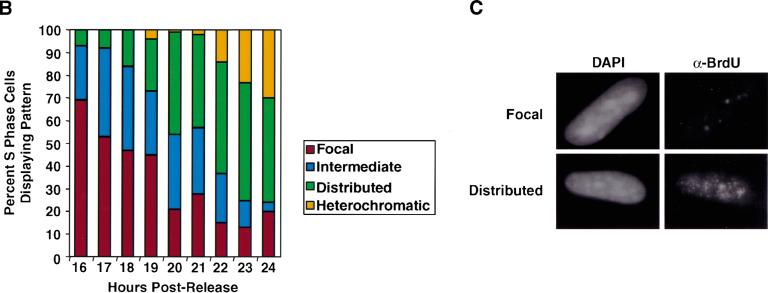
Figure 2.
DNA replication patterns in primary cells during S-phase progression. (A) FACS analysis was performed on WI38 cells released from contact inhibition. Upper panels plot cell number versus DNA content. Lower panels plot BrdU versus DNA content. Cells enter S-phase at ∼16 h postrelease and are in late S-phase by 24 h. (B) Quantitation of different replication patterns during S-phase progression. Only cells actively incorporating BrdU were included. (D) Images depict sites of BrdU incorporation either in the focal pattern (top) or the distributed pattern (bottom). These images were generated using standard immunofluorescence microscopy, which was used to generate all quantitative data.


