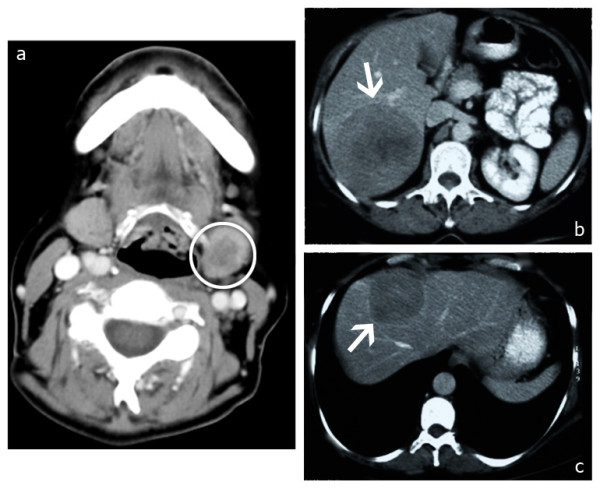
Figure 1.

Pre-therapy imaging. (a) The primary tumor. Adenoid cystic carcinoma of the left submandibular salivary gland is indicated by the circle. (b) and (c) Computed tomography (CT) of the liver before chemoembolization showing the two main lesions. (b) A 10 cm lesion involving segments VI and VII is indicated by the arrow. (c) A 4.7 cm lesion involving segments VIII and IVA is indicated by the arrow. Three more lesions in segments IVA, IVB, and II, which measured 1.5 cm, 1 cm, and 1.8 cm, respectively, were identified.
