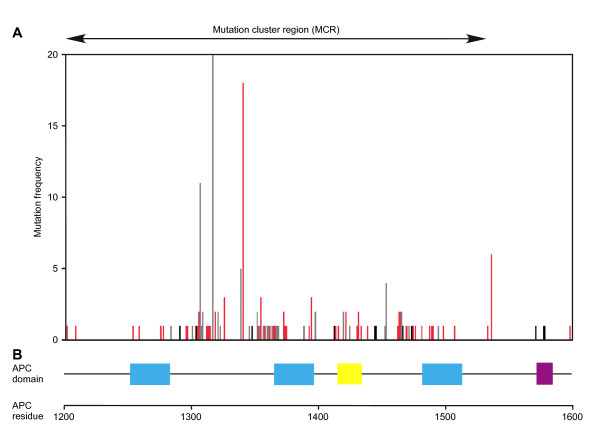
Figure 3.
Missense mutations cluster outside the β-catenin binding motifs in the MCR of APC. (A) Closeup on missense mutation frequency in MCR. Color code as in Figure 1C. (B) Domain structure of the MCR, color code as in Figure 1A. We calculated mutation frequency by dividing the number of mutations in a particular codon by the total number of missense mutations reported in all referenced studies.

