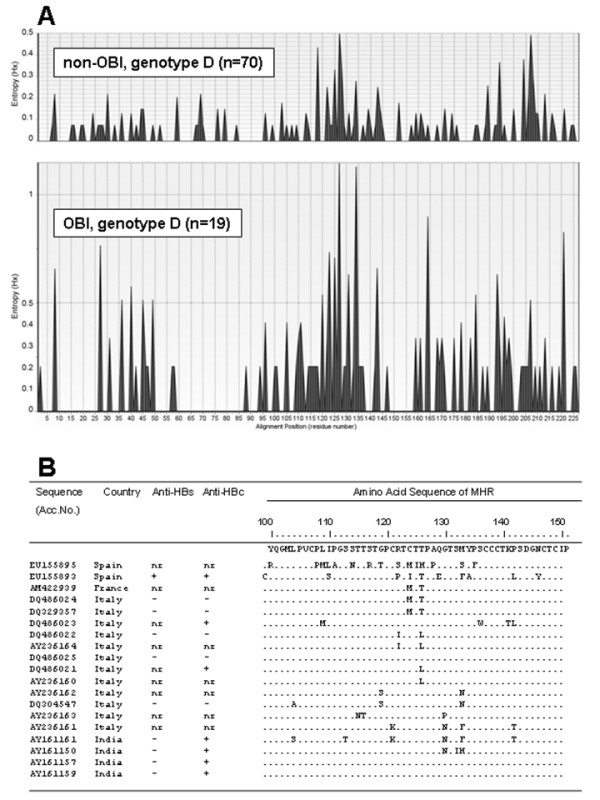
Figure 3.

Variation of the Small S protein of genotype D OBI and non-OBI sequences. A: variation along the complete Small S protein of genotype D OBI and non-OBI sequences shown by entropy plots (see Materials and Methods). Entropy values (Hx) are a measure of variation at each amino acid position in the set of aligned sequences. It can vary from 0 (i.e. no variation) to 3.04 (i.e. all the possible 20 amino acids or a gap occur in equal frequency in a position. B: amino acid variations in the MHR of HBsAg in 19 genotype D OBI sequences vs. a consensus from genotype D non-OBI sequences. Accession number and country of origin of each sequence are reported.
