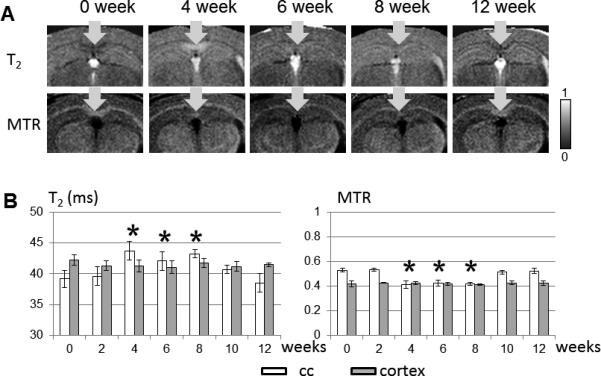
FIG. 2.

In vivo single subject coronal T2-weighted and MTR images of the caudal corpus callosum (a) and T2 and MTR values of the caudal corpus callosum and cortical ROIs over time (b). * indicates that a value is significant different from the baseline value (0 week) with p < 0.05 after correction for multiple comparison. The error bars show the standard deviations of the measurements (n=5 at each time point).
