
FIG. 4.
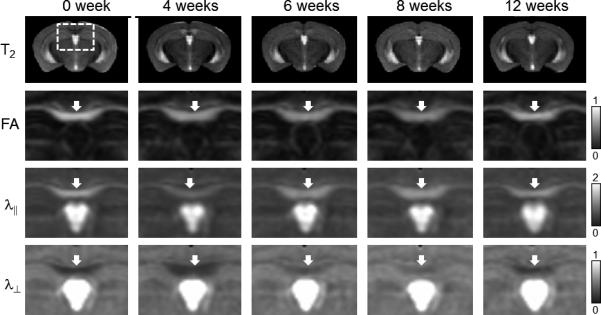
Average in vivo T2, FA, λ∥, and λ⊥ images of the cuprizone treated mouse brains. Coronal images are shown in the figure. White arrows indicate the locations of the caudal corpus callosum. The unit for the λ∥ and λ⊥ are x10-3 mm2/s.
Official websites use .gov
A
.gov website belongs to an official
government organization in the United States.
Secure .gov websites use HTTPS
A lock (
) or https:// means you've safely
connected to the .gov website. Share sensitive
information only on official, secure websites.
Average in vivo T2, FA, λ∥, and λ⊥ images of the cuprizone treated mouse brains. Coronal images are shown in the figure. White arrows indicate the locations of the caudal corpus callosum. The unit for the λ∥ and λ⊥ are x10-3 mm2/s.