
FIG. 7.
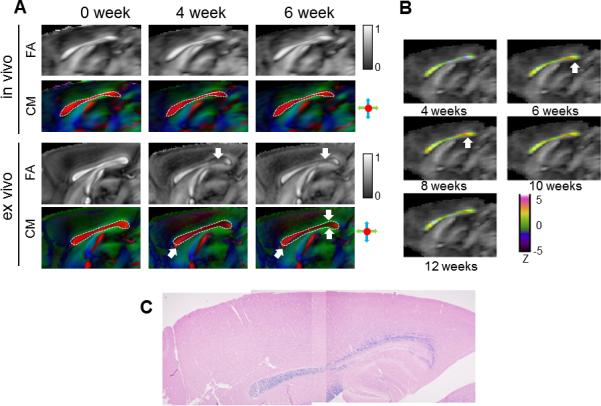
a: Average in vivo and ex vivo FA and colormap (CM) images of cuprizone treated mouse brains at baseline, 4 and 6 week time points. The images were from the mid-sagittal plane. In both the in vivo and ex vivo images, the boundary of the corpus callosum in the mid-sagittal plane was delineated in the 0 week average CM images and overlaid on CM images at the 4 and 6 week time points. White arrows indicate the reduced FA in the ex vivo FA images at the 4 and 6 week time points and shape mismatches in the ex vivo images between baseline and later time points. b: Average in vivo FA images overlaid with Z scores of λ⊥ in the corpus callosum from the 4 to 12 week time points. In the pseudo-colored images, red and orange indicate increases in λ⊥, blue and purple indicate decrease in λ⊥, and green indicate no apparent change in λ⊥, with respect to the baseline level. c: LBF stained stained histological image of mid-sagittal corpus callosum at the 6 week time point.