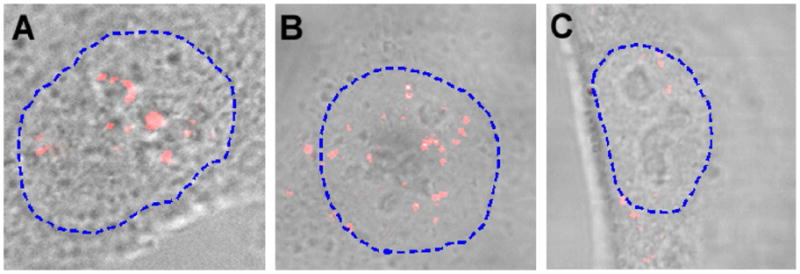
Figure 4.

Imaging of U3 snoRNA, U1 and U2 snRNAs in the nucleus of living cells using NLS-linked molecular beacons. (a) Fluorescence signal of molecular beacons targeting U3 snoRNA in the nucleus of a living cell. Note that most of the localized signal was in the nucleolars, with no signal in the cytoplasm. (b) Imaging of U1 snRNA showing localized fluorescence signal in the nucleoplasm of a living cell excluding the nucleolus. Note that the discrete foci of U1 snRNPs are widely distributed in the nucleoplasm, with a few foci in the peri-nucleolar region. Note also the localized signal of U1 snRNPs in the peri-nuclear region of the cytoplasm, indicating the population of the U1 snRNAs exported to the cytoplasm for processing of its 5’ cap. (c) The fluorescence signal suggests that the localization of U2 snRNAs in the nucleus is similar to that of U1 snRNAs but with a much lower abundance.
