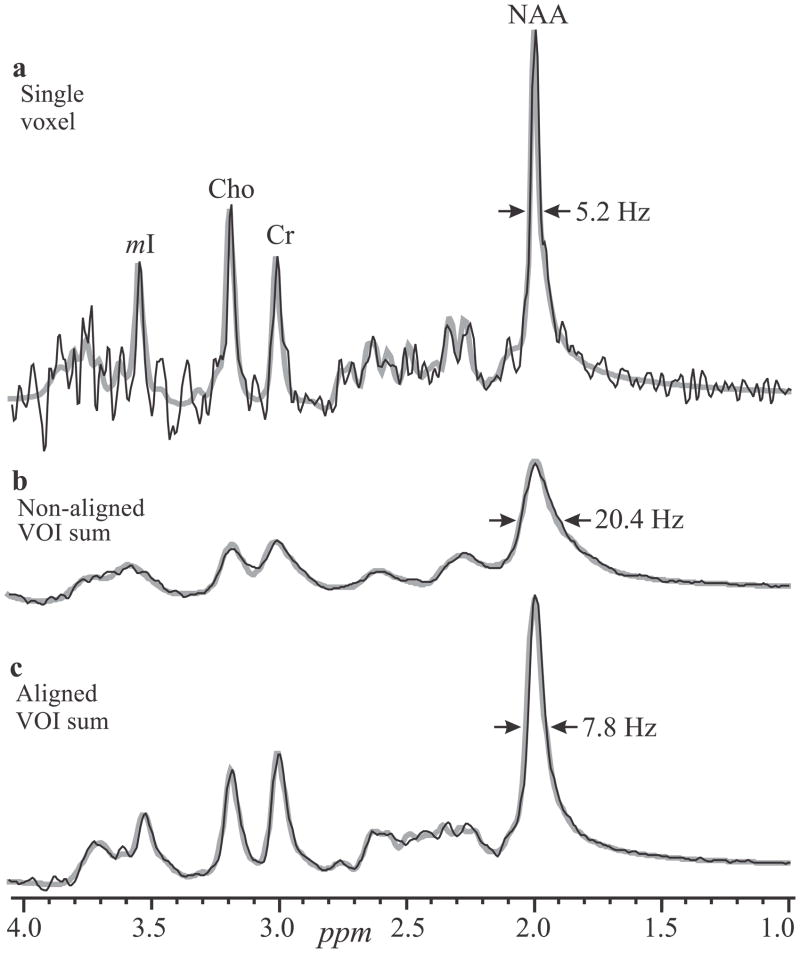
Fig. 2.
Real part of 1H spectra (black lines) superimposed with their fitted model functions (gray lines). Top, a: Spectrum from a single 0.75 cm3 voxel from subject #8 in Table 1. b: Non-aligned sum of all 480 spectra in the VOI (equivalent to a 360 cm3 single-voxel acquisition) of the same subject. Note the better SNR compared with a, but ×2.5 fold degraded linewidth. Bottom, c: Same as b, but with spectral alignment prior to summation, resulting in ×2.5 better spectral resolution and SNR compared with b.

