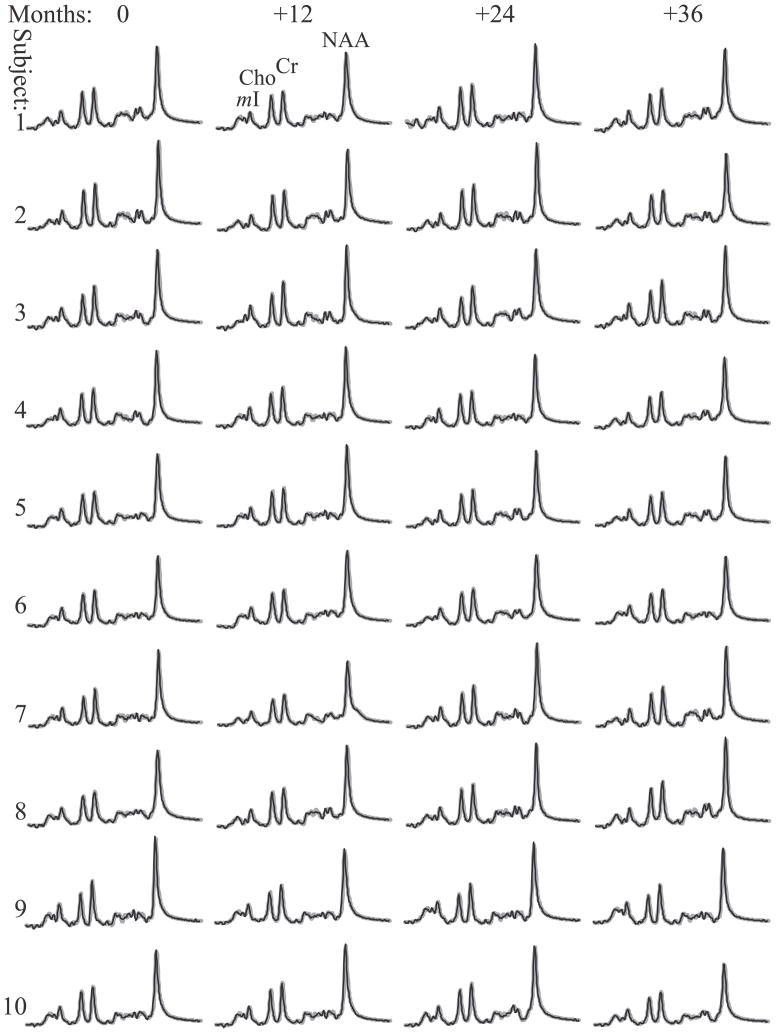
Fig. 3.
Real part of the 480 pre-aligned then summed 1H spectra from the VOI of each of the 10 subjects and their 4 annual time point (black lines) superimposed with the fitted model functions (gray lines) on common frequency and intensity scales. Note: (i) the excellent 130 (mI) – 560 (NAA) SNRs and linewidths of the sums compared with the individual voxels in Fig. 1; (ii) the quality of the fit; and (iii) the visual similarity in metabolic levels both among the subjects (inter-individual) at each time point, and between time points (intra-individual).

