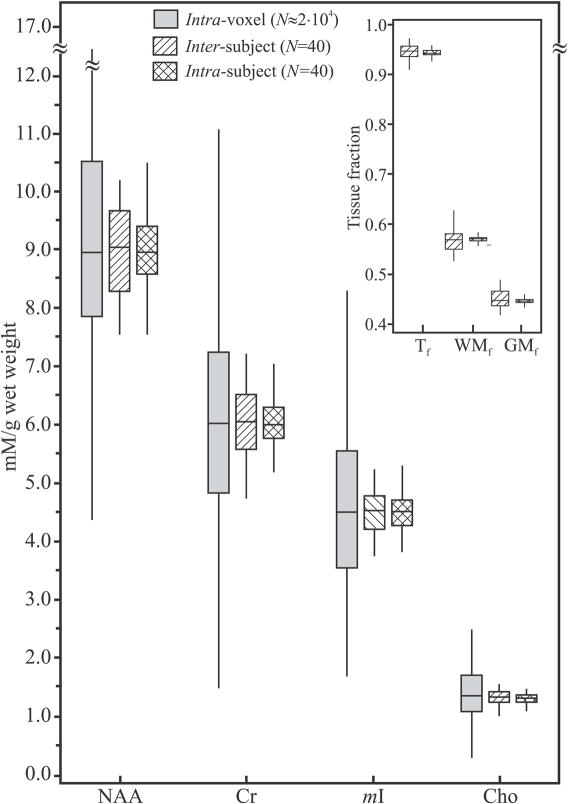
Fig. 4.
Box plots displaying the 25th, median and 75th (box) as well as ±95th percentiles (whiskers) of the NAA, Cr, Cho and mI absolute concentrations distributions for single voxels, intra-voxel, shaded; and the summed spectra: single time points across all subjects (inter-subject, right-hatched) and all time points of the same subject (intra-subject, cross-hatched). Note the dramatic, ×4 to ×5 fold, improvement in both cross-sectional and longitudinal repeatability of the sums compared with the single voxels. Insert: Box plots of the GM, WM and tissue fractions (GMf, WMf and Tf) distributions in the VOIs of all subjects. Note the narrow distribution of tissue types, indicating the minimal GM/WM/CSF partial volume repositioning error of the proposed approach.

