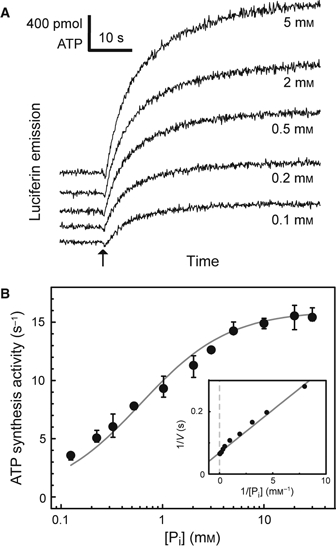
Fig. 5.

Phosphate dependence of synthesis activity. Activity was measured at 30 °C in the presence of a saturating ADP concentration of 0.5 mm under an imposed PMF of 330 mV (pHout = 8.8, pHin = 5.65, [K+]out = 105 mm, [K+]in = 0.6 mm). The amount of contaminant Pi was 25 μm, and is not corrected for. (A) Time courses. (B) Phosphate dependence. The line shows a Michaelis–Menten fit with  = 0.55 mm and Vmax = 16 s−1. Inset: Lineweaver–Burk plot.
