
Figure 1.

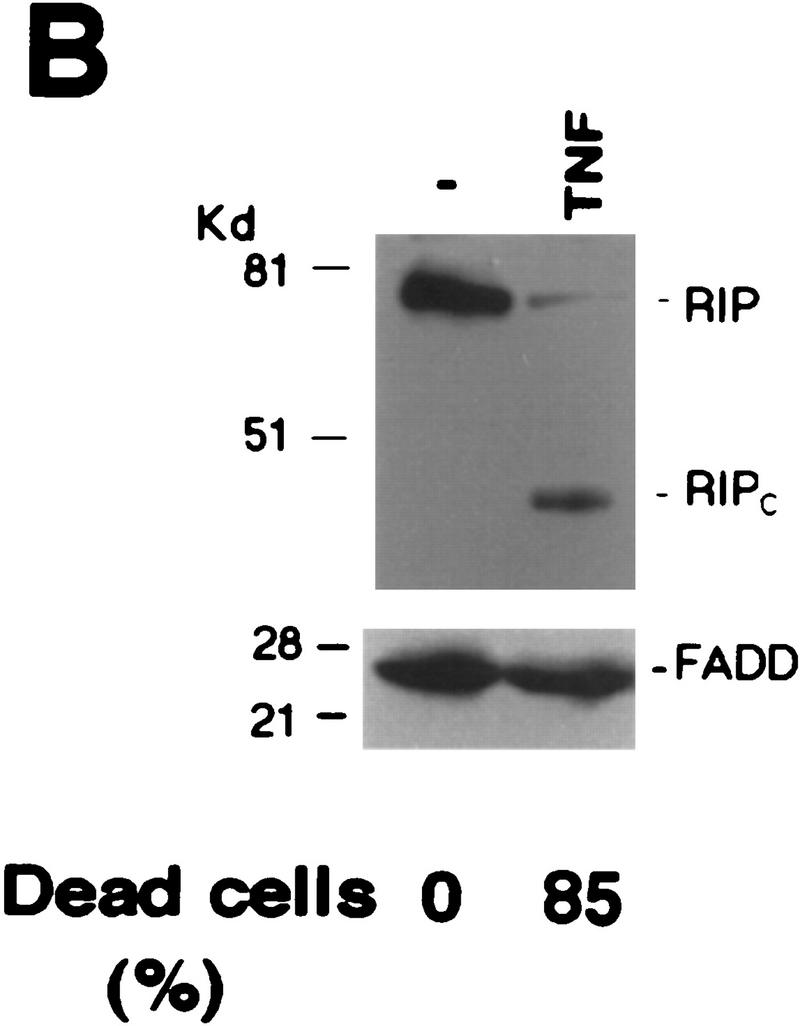


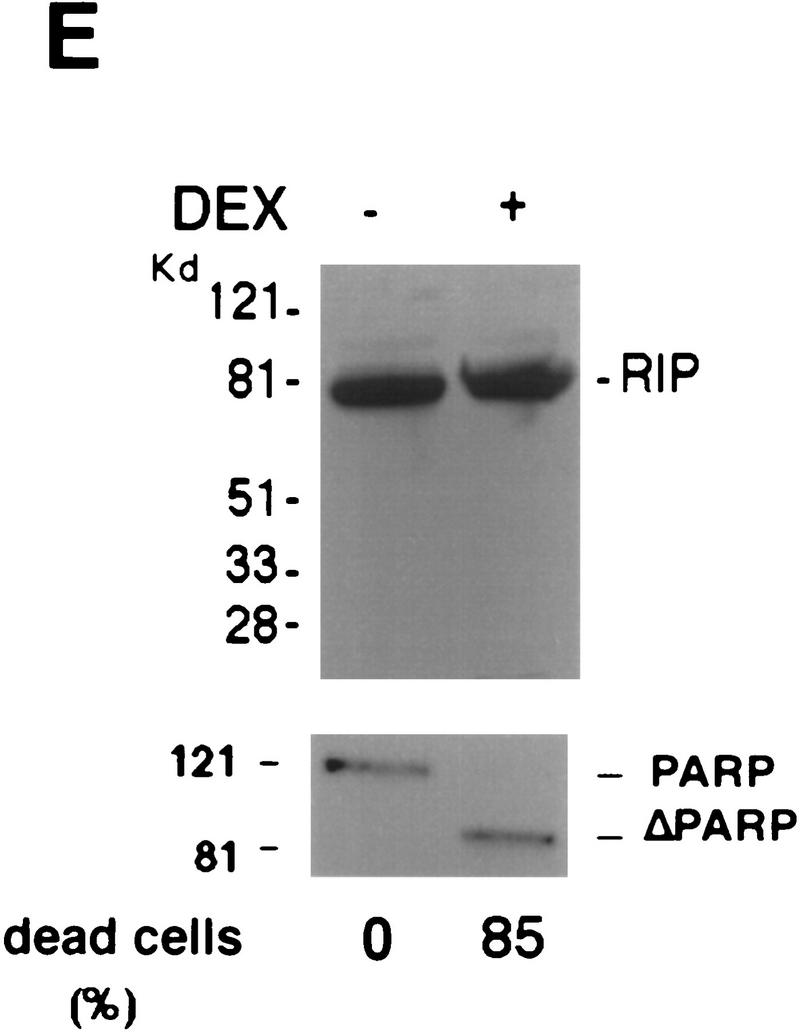
Cleavage of RIP in TNF-induced apoptosis. (A) HeLa cells were treated with TNF (15 ng/ml) (lane 2); CHX (10 μg/ml) (lane 3); or TNF (15 ng/ml) + CHX (10 μg/ml) (lane 4) for 10 hr. Cell extracts were resolved on SDS-PAGE and then Western blotted for RIP (top) and FADD (bottom). Untreated cell extract was loaded as a control (lane 1). (B) MCF7 cells were treated with TNF (15 ng/ml) for 18 hr. RIP and FADD were detected by Western blot. (C) Time course of RIP cleavage in TNF induced apoptosis in HeLa cells. Cells were treated with TNF (15 ng/ml) + CHX (10 μg/ml) and incubated for the indicated time periods. RIP and FADD were detected by Western blot analysis. (D) HeLa cells were treated with TNF (15 ng/ml) + CHX (10 μg/ml) for 6 hr (lane 2); UVC (20 J/m2, followed by overnight culture) (lane 3); and staurosporine (1 μm) overnight (lane 4). Cell extracts were resolved on SDS-PAGE and Western blotted for RIP (top), PARP (middle), and FADD (bottom). Untreated cell extract was loaded as a control (lane 1). (E) 2B4 cells were treated with DEX (1 μm) for 10 hr, and RIP and PARP were detected by Western blot analysis. Cell death was determined by trypan blue exclusion staining. The percentages of dead cells are at the bottom of the panels. Data are normalized to the rate of spontaneous cell death occurring in untreated cells (<5%). The positions of the molecular mass markers are indicated in kD at left of panels.