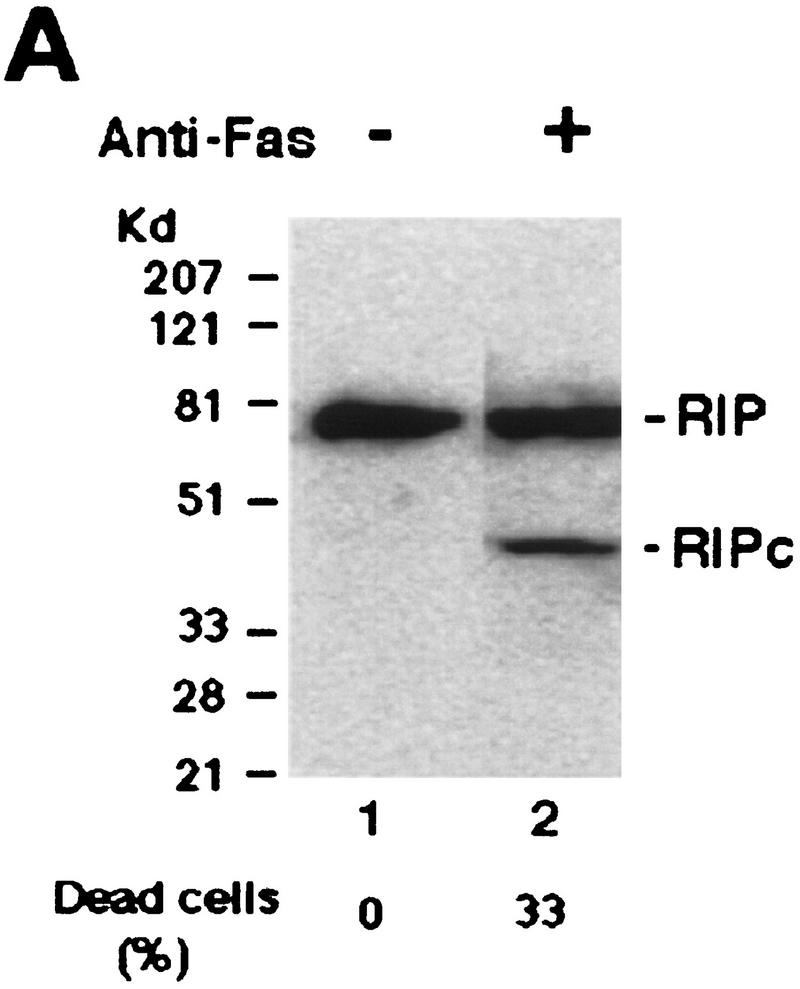
Figure 6.
Cleavage of RIP in Fas and TRAIL induced apoptosis. (A) Jurkat cells were treated with anti-Fas (IgM, 250 ng/ml) for 6 hr (lane 2) and RIP protein was detected by Western blot analysis. (Lane 1) Untreated cell extract. The percentages of dead cells were shown at the bottom of the panel. (B) HeLa cells were treated with TRAIL (0.5 μg/ml) for 2 hr (lane 2) and RIP protein was detected by Western blot analysis. (Lane 1) Untreated cell extract. The percentages of dead cells are shown at the bottom of the panel. The positions of the molecular weight markers are indicated in kD at left. (C) Wild-type or RIP-deficient Jurkat cells were treated with TNF (15 ng/ml) + CHX (10 μg/ml), TRAIL (0.5 μg/ml), anti-Fas (250 ng/ml), or UVC (20J/m2), and followed by 6 hr culture. Cell death was determined by trypan blue exclusion staining. The percentages of dead cells shown are the average of three independent experiments. The probabilities in these experiments between wild-type RIP (open bars) and RIP− (solid bars) cells are nontreated, >0.9; TNF/CHX, <0.025; TRAIL, <0.025; Fas, <0.005; and UV, >0.1.


