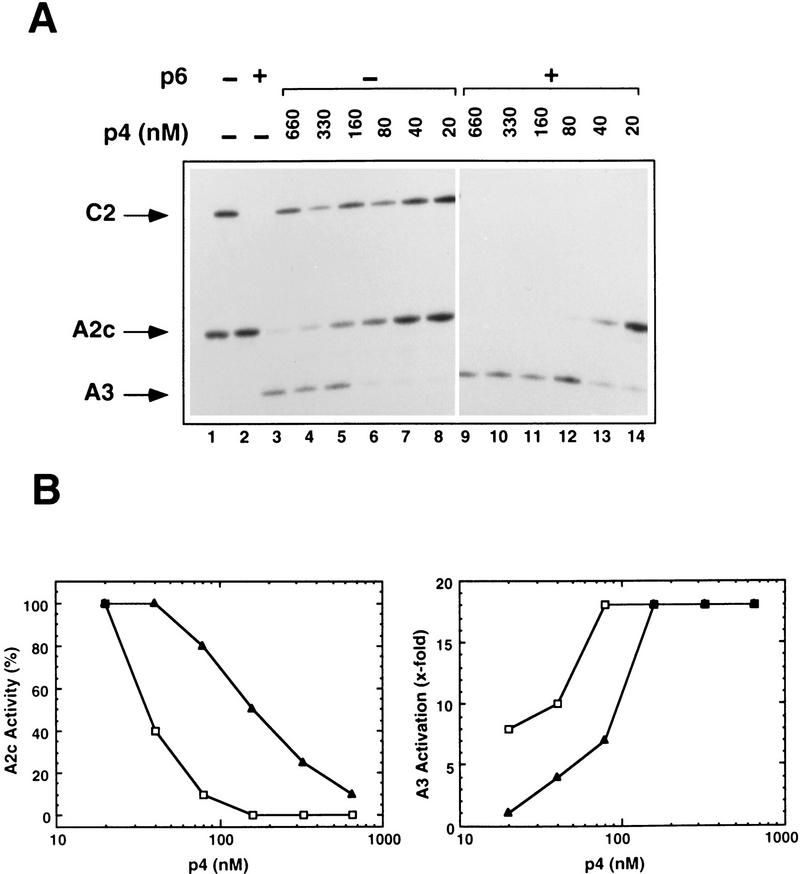
Figure 2.
(A) Effect of p6 on activation of PA3 and repression of PA2c by p4. The complete φ29 genome was used for in vitro transcription reactions including RNAP (20 nm) and p4 (at the indicated concentrations) or p4 and p6 (14.4 μm). In reactions containing p6, the template DNA was preincubated with the protein for 10 min at 37°C. Transcripts corresponding to PA2c, PA3, and PC2 (as control for p6 activity) were detected by primer extension. (B) Quantitative representation of the data shown in A. PA2c repression is expressed as percent activity remaining in the presence of p4 (▴) or p4 and p6 (□). PA3 activation refers to the levels of transcription observed in the presence of p4 (▴) or p4 and p6 (□) relative to those obtained in their absence. Numbers for PA2c and PA3 transcription obtained from lanes 1-8 were corrected using PC2 transcription as a standard.

