
Figure 2.
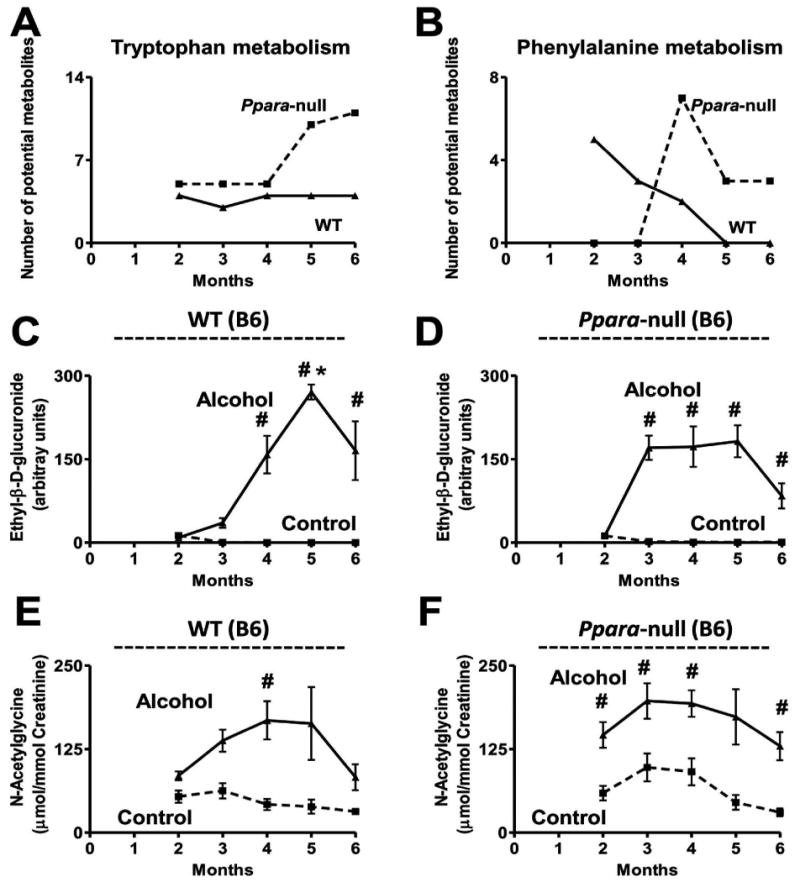
Effect of chronic alcohol consumption on tryptophan, phenylalanine, and alcohol metabolism in B6 mice. Variation in the number of putative metabolites, predicted by MassTRIX analysis, elevated in (A) tryptophan metabolism detected in ESI+ mode and (B) phenylalanine metabolism detected in ESI- mode, during alcohol treatment. The solid and dotted lines represent the response of the wild-type and Ppara-null mice, respectively. (C) Variation in the urinary abundance of ethyl-β-D-glucuronide in the control (dotted line) and alcohol-treated (solid line) wild-type and (D) Ppara-null mice. (E) Variation in the urinary excretion of N-acetylglycine in the control (dotted line) and alcohol-treated (solid line) wild-type and (F) Ppara-null mice. Oneway ANOVA with Bonferroni's correction for multiple comparisons was used to estimate statistical significance of the variation of the metabolites on alcohol-treatment. One-way ANOVA with Bonferroni's correction for multiple comparisons was used to estimate statistical significance of the variation of the metabolites on alcohol-treatment within same background. #, significantly different (P < 0.05) from control mice of same genotype and *, significantly different (P < 0.05) from alcohol-treated Ppara-null mice.