
Figure 6.
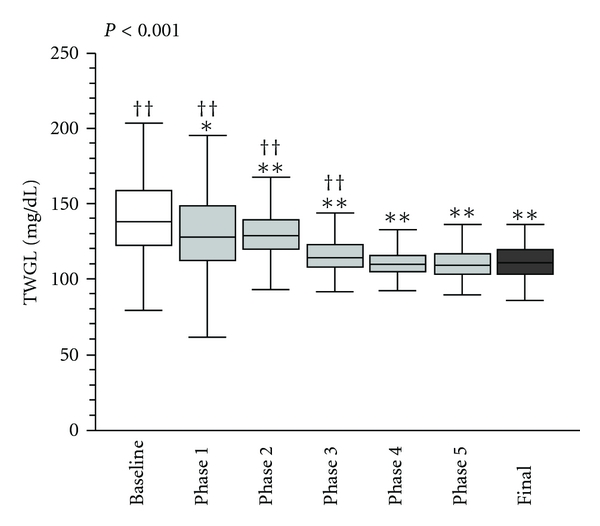
TWGL by phase of intervention (retrospective data analysis). Box-and-whisker plot represents TGWL (mg/dL) by phase. *P < 0.05 and **P < 0.01 (versus baseline) and † P < 0.05 and †† P < 0.01 (versus final phase).
Official websites use .gov
A
.gov website belongs to an official
government organization in the United States.
Secure .gov websites use HTTPS
A lock (
) or https:// means you've safely
connected to the .gov website. Share sensitive
information only on official, secure websites.
TWGL by phase of intervention (retrospective data analysis). Box-and-whisker plot represents TGWL (mg/dL) by phase. *P < 0.05 and **P < 0.01 (versus baseline) and † P < 0.05 and †† P < 0.01 (versus final phase).