Figure 7.

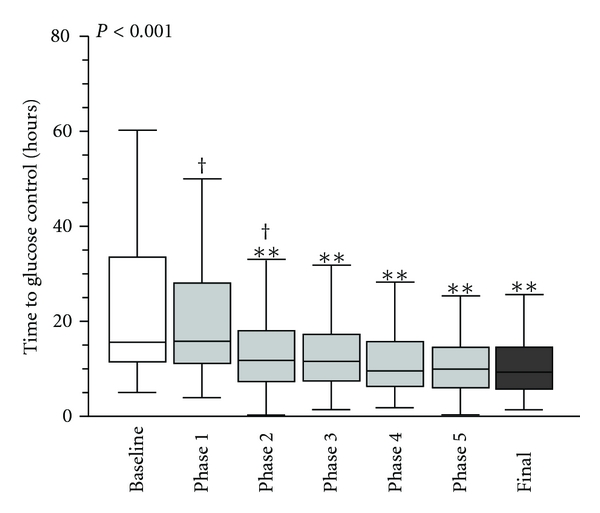
Time to control (retrospective data analysis). Box-and-whisker plot represents time to control (mg/dL) by phase. *P < 0.05 and **P < 0.01 (versus baseline) and † P < 0.05 and †† P < 0.01 (versus final phase).

Time to control (retrospective data analysis). Box-and-whisker plot represents time to control (mg/dL) by phase. *P < 0.05 and **P < 0.01 (versus baseline) and † P < 0.05 and †† P < 0.01 (versus final phase).