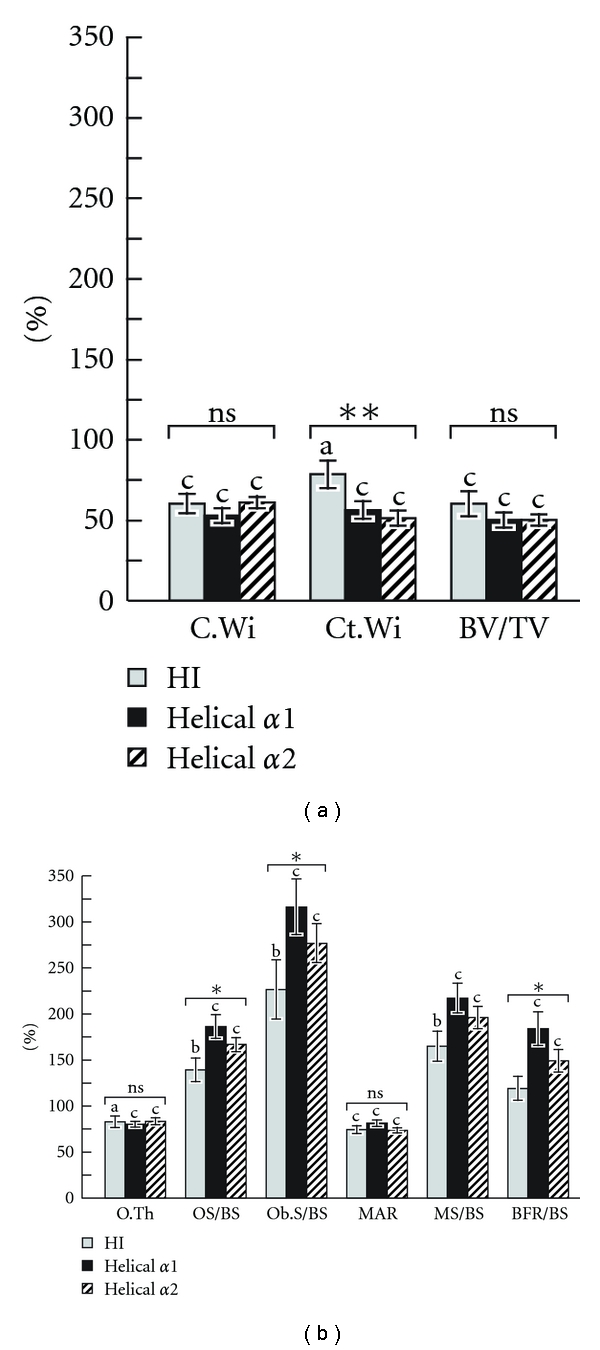
Figure 4.

Iliac bone histomorphometric results in patients with COL1A1 haploinsufficiency mutations (HI), as well as with COL1A1 and COL1A2 mutations leading to glycine substitutions in the helical domain of collagen type I. Results are expressed as a percentage of the average result in the age-specific reference range [14]. The letters above the bars indicate the significance of the difference from 100% (i.e., the average result in healthy controls): a: P < 0.05; b: P < 0.01; c: P < 0.001. The significance of the variation between genotype groups is indicated by the symbols above the bar groups: ns = not significant; *P < 0.05; **P < 0.01; (a) C.Wi: core width; Ct.Wi: cortical width; BV/TV: bone volume per tissue volume; (b) O.Th: osteoid thickness; OS/BS: osteoid surface per bone surface, Ob.S/BS: osteoblast surface per bone surface; MAR: mineral apposition rate; MS/BS: mineralizing surface per bone surface; BFR/BS: bone-formation rate per bone surface, adapted with modification from [11].
