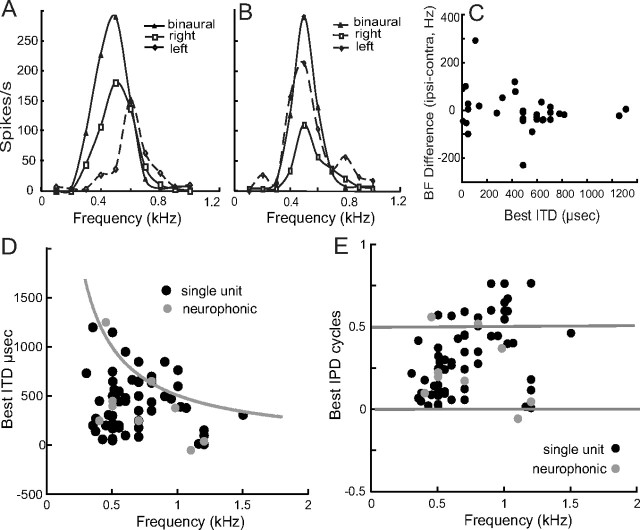
Figure 8.
Relationships between best frequency and ITD. A, Isointensity rate functions from ipsilateral and contralateral and binaural stimulation of unit 4.24. The BFs of the responses to ipsilateral and contralateral stimulation do not precisely match (see C). B, Isointensity rate functions from ipsilateral and contralateral and binaural stimulation of unit 4.39. The BF of the responses to the two inputs were well matched but the inputs were not of equal strength. C, Differences in the ipsilateral and contralateral center frequencies of 31 NL neurons are plotted against their best ITDs (filled circles). For the stereausis model to apply, the largest ITDs should have the biggest frequency mismatch, which was not seen in this dataset. There was no significant correlation of frequency difference and best ITD (y = −0.068x + 30.16, r2 = 0.05). Median differences were 13 Hz (n = 29) for the paired BFs. D, Best ITD showed less scatter with increasing BF for all single units (black circles) and neurophonic recordings (gray circles). The gray line follows ITD values corresponding to 0.5 cycles, the “π-limit.” E, Best IPD as a function of BF, in the same format as D.

