
Figure 2.
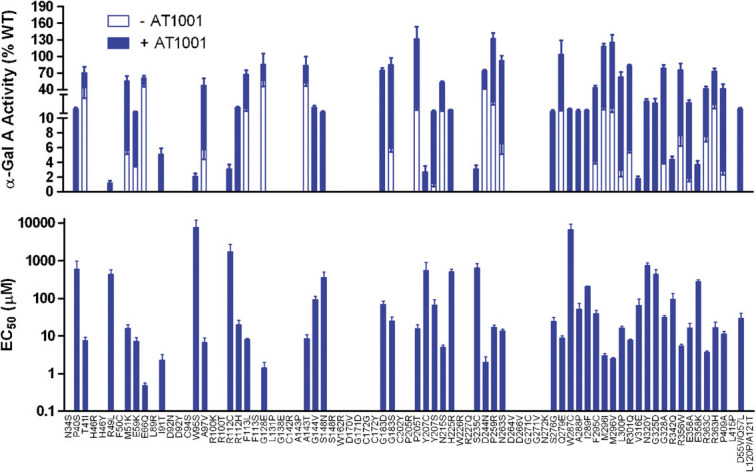
AT1001 increases the activity of different α-Gal A mutant forms with varying magnitude and potency. Top panel: Eighty-one mutant forms were evaluated in the HEK-293 cell-based assay for response to incubation with AT1001. The average baseline (open bars) and maximally increased (blue/dark bars) α-Gal A activity in the absence or presence of AT1001, respectively, are shown. The data have been normalized to the α-Gal A activity of untreated wild-type. Bottom panel: The average EC50 values (expressed as µM) for AT1001 to increase the α-Gal A activity of each mutant form are shown. For both panels, α-Gal A mutant forms were plotted in order of their positions on the amino acid sequence. Bars represent mean ± SEM of at least three independent experiments conducted for each mutant form. Mutant forms with no associated bar did not have any quantifiable baseline α-Gal A activity nor response to AT1001 at the concentrations tested. [Color figures can be viewed in the online issue, which is available at http://www.wiley.com/humanmutation.]