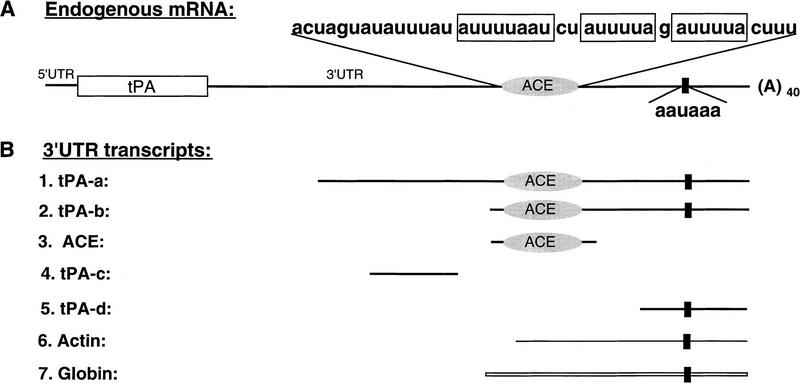
Figure 1.
Schematic representation (not drawn to scale) of endogenous tPA mRNA and of different 3′-UTR RNA transcripts. (A) Endogenous tPA mRNA. (Open rectangle) Coding region; (solid lines) 5′ and 3′ UTRs; (oval symbol) ACE region, the sequence of which is indicated above (three UA-rich sequences are boxed). (Solid, vertical rectangle) Polyadenylation signal (AAUAAA). The poly(A) tail of ∼40 adenosine residues present on tPA mRNA in primary oocytes is indicated [(A)40]. (B) 3′ UTR transcripts. Two different 3′-UTR transcripts containing both the ACE region and the polyadenylation signal are named tPA-a (479 nucleotides) and tPA-b (115 nucleotides); ACE (83 nucleotides), tPA-c (83 nucleotides) and tPA-d (80 nucleotides) correspond respectively to the ACE region detailed in A (plus vector-derived 5′ and 3′ sequences) and to two regions flanking the ACE; tPA-d encompasses the polyadenylation signal. Actin and Globin represent the 3′ terminal fragments of β-actin (133-nucleotide) and β-globin (165-nucleotide) mRNAs, respectively.

