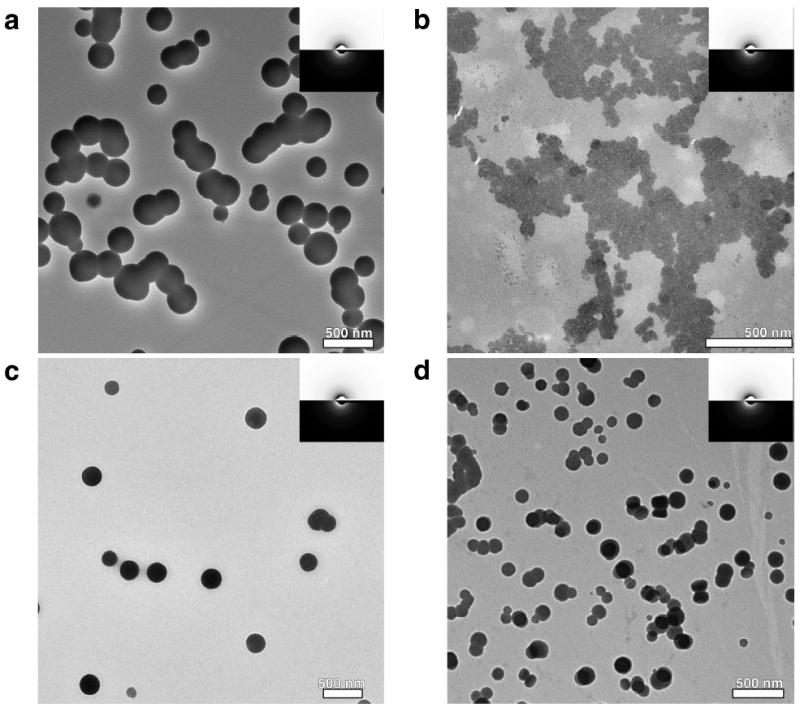
Figure 4.

TEM micrographs of precipitations of CaCO3 (a) in absence of ovo-proteins, (b) in presence of 7.5 mg·mL-1 lysozyme, (c, d) in presence of 7.5 mg·mL-1 ovalbumin. The sampling was done at different times: (a,b) 400 s, (c) 500 s and (d) 1000 s. The respective electron diffraction patterns are shown in the insets and indicate the amorphous state of the droplets.
