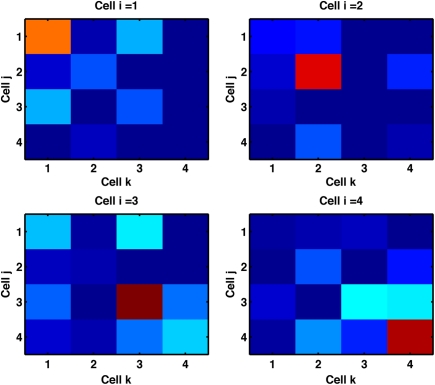
Figure 8.
Cells with similar response properties cluster together. We label each cell by the stimulus-pair to which it is most responsive. For each of the three cells (indexed i, j, k) in fully, bidirectionally connected triplets (all examples of motif 16) we record the combinations of three most responsive stimuli. Color denotes the counts of these combinations across the network. The single highlighted squares on the diagonal indicate triplets of cells most responsive to the same stimuli are found fully connected. For example, the top-left panel shows that a cell most responsive to stimulus-pair A + B is predominantly found in triplets with both other cells most responsive to stimulus-pair A + B. Results are from the default network (input probability of 1/20 and 6 cell groups per input) trained with triplet-STDP and LTPi for 2000 trials of the biconditional discrimination task.

