Figure 2.
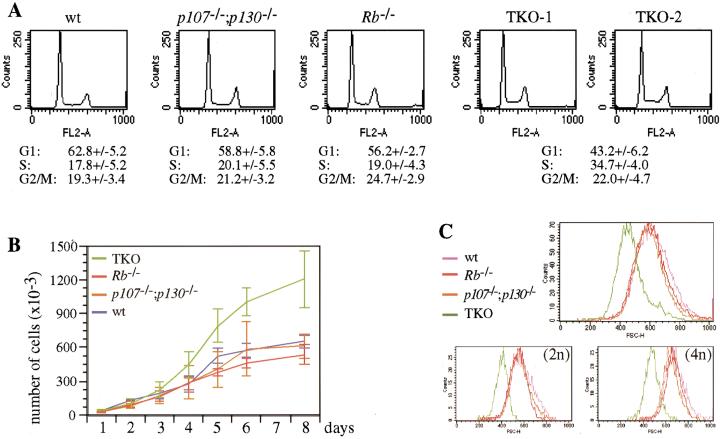
Cell cycle analysis of TKO and control MEFs. (A) Flow cytometric cell cycle analysis of representative wild-type (wt), Rb−/−, p107−/−;p130−/−, and TKO MEF cultures. G1, S, and G2/M populations are indicated as percentages of the whole population. Numbers correspond to the average of at least five independent experiments, with standard deviations (+/−). (B) Proliferation curves of TKO and control MEFs. The curves represent the average of three experiments for control MEFs and five for TKO MEFs, with standard deviations (error bars). (C) Cell size analysis of TKO and control MEFs. Asynchronously proliferating cells fixed and stained with PI were analyzed by flow cytometry. Populations were gated in a FSC-H by FL2-A dot plot and scored in a FSC-H histogram. The top panel represents whole populations and the two bottom panels 2n and 4n populations, as indicated.

