Figure 1.
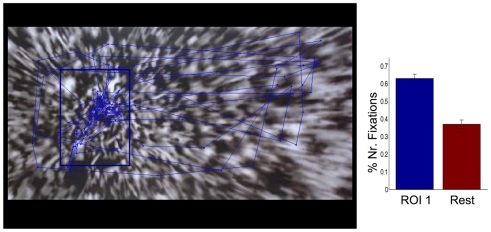
“Center of gaze” by Mariano Molina with the saccades and fixations of one subject during a free viewing of the painting for 1 min. Note the larger number of fixations to the area in focus in the middle left. The right hand side plot shows the average relative number of fixations for 10 subjects in this region of interest (ROI1, marked in blue in the painting) compared to the rest of the canvas. The lines on top of the bars denote SEM.

