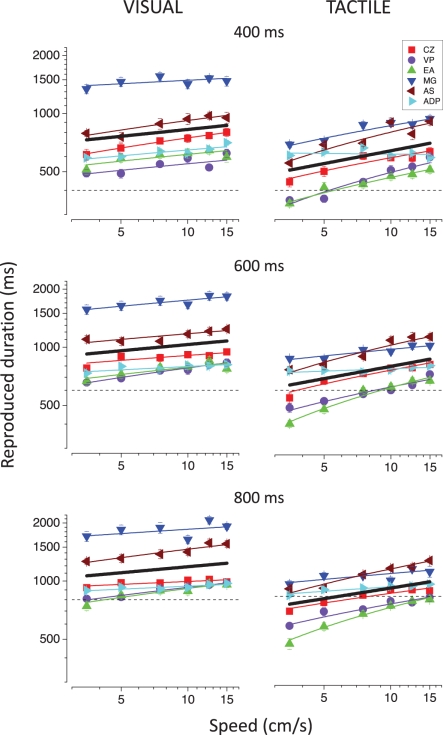
Figure 2.
Individual reproduced durations as a function of speed for the visual (left column) and the tactile (right column) stimuli. Different colors represent different subjects. The black solid lines represent the best-fitting linear functions for the average reproduced durations. The results for the 400, 600, and 800 ms durations are reported in the upper, middle, and lower panels, respectively. The dashed lines indicate the actual physical durations of the stimuli.

