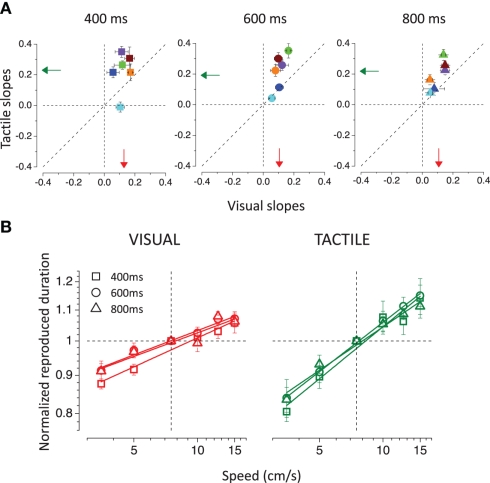
Figure 4.
(A) Tactile slopes plotted against visual slopes. The slopes were calculated, separately for each subject and condition, from the linear regression of the normalized reproduced durations (divided by the reproduced duration obtained for the 7.5-cm/s moving stimuli) as a function of speed. Different colors represent different subjects. The vertical and horizontal dashed lines indicate absence of dependence on speed, the diagonal shows equal dependence for vision and touch. The arrows show the averages for the visual (in red) and for the tactile (in green) conditions. (B) Normalized reproduced durations averaged across subjects are plotted as a function of speed for the visual (on the left) and tactile (on the right) stimuli. Different stimulus durations (400, 600, and 800 ms) are represented by different symbols.

