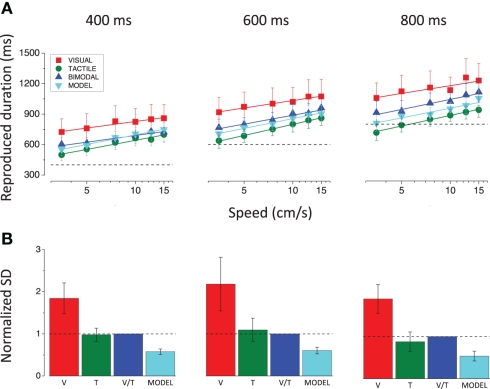
Figure 6.
(A) Reproduced durations averaged across subjects, plotted as a function of speed, separately for the three stimulus durations (400, 600, and 800 ms). The dashed lines indicate the actual physical durations of the stimuli. (B) Average normalized SDs for all conditions and stimulus durations. The variances for all speeds and subjects were first divided by the bimodal variance, then summed and square-rooted to yield the SDs. The dashed lines show the normalized bimodal SDs.

