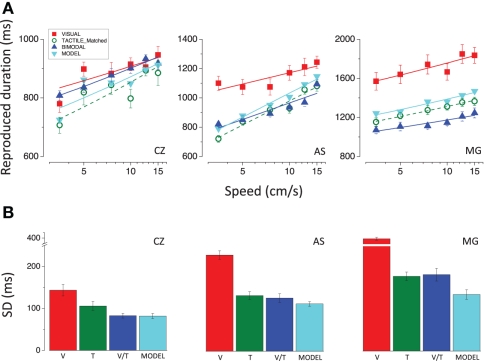
Figure 8.
(A) Reproduced durations as a function of speed relative to the 600 ms stimuli. The green open symbols represent the reproduced durations for the tactile stimuli moving at the same perceived speed as the visual stimuli (red filled symbols). Blue symbols represent the results for the bimodal stimuli (visuo-tactile speed-matched stimuli) and the cyan symbols represent the results for the bimodal stimuli predicted according to Bayesian integration. (B) SDs of the reproduction averaged across speeds relative to the 600 ms visual (red bar), tactile (green bar), and bimodal (blue bar) stimuli and predicted for bimodal stimuli according to the Bayesian model (cyan bar); results for all subjects.

