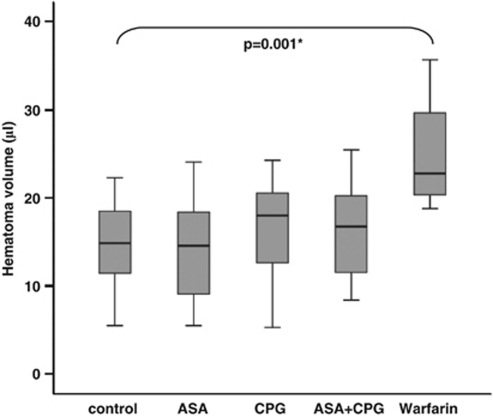
Figure 4.
Hematoma volume determined 24 hours after hemorrhage induction by means of quantitative hemoglobin content determination for untreated control mice, ASA mice, CPG mice, and ASA+CPG mice (n=20 per group). Warfarin mice served as a positive control (n=4). One-way ANOVA revealed no differences between treatment groups (ASA, CPG, ASA+CPG) and controls. The t-test was used for comparison between warfarin mice and controls. * Indicates significant differences. ANOVA, analysis of variance; ASA, acetyl-salicylic acid; CPG, clopidogrel.

