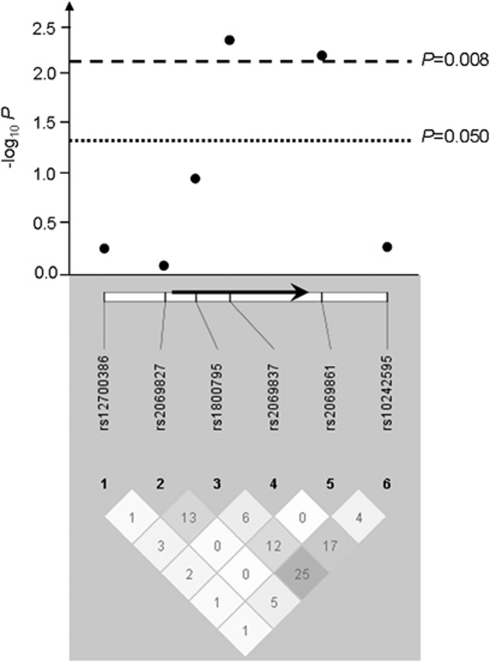
Figure 1.
IL6 association results (−log10 P) with stroke susceptibility and pairwise r2 among genotyped SNPs in our population sample. The positions of the six SNPs relative to the IL6 gene (represented by an arrow) are indicated. The magnitude of linkage disequilibrium (r2) is represented by the white–black gradient shading and the values within each diamond. Association results above the line −log10 P=1.3 are considered significant (P<0.050); and those above −log10 P=2.1 survive Bonferroni correction (P<0.008). Linkage disequilibrium blocks were generated using the Gabriel et al (2002) method.

