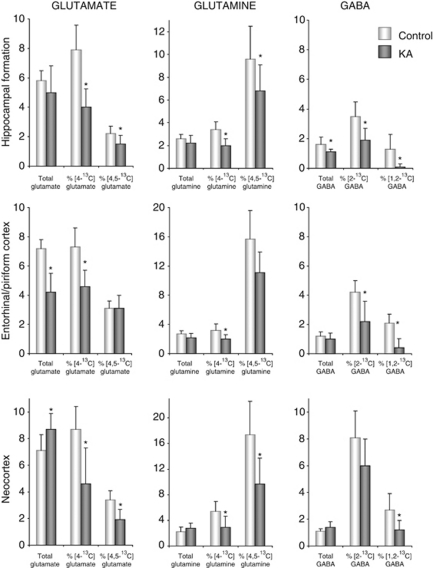
Figure 2.
Total concentrations and percentage of 13C enrichment of glutamate, glutamine, and γ-aminobutyric acid (GABA), as measured by 1H and 13C magnetic resonance spectroscopy (MRS). Total concentrations (μmol/g tissue) of glutamate, glutamine, and GABA, and their percentage of 13C enrichment, as measured by 1H and 13C MRS. The MRS analyses were performed on brain extracts of the hippocampal formation, entorhinal/piriform cortex, and neocortex from animals injected with [1-13C]glucose and [1,2-13C]acetate 15 minutes before decapitation. The experimental groups comprised animals injected with either saline (controls; white bars) or kainate (KA; gray bars) 2 weeks earlier. Sample sizes for 13C and 1H MRS, respectively: controls n=8 and 9, KA n=9 and 11 (hippocampal formation); controls n=3, KA n=8 and 11 (entorhinal/piriform cortex); and controls n=8 and 10, KA n=6 (neocortex). The labeling in [4-13C]glutamate, [4-13C]glutamine, and [2-13C]GABA mostly derives from neuronal metabolism of [1-13C]glucose, the labeling in [4,5-13C]glutamate, [4,5-13C]glutamine, and [1,2-13C]GABA exclusively derives from the metabolism of [1,2-13C]acetate in astrocytes. %, Enrichment is expressed as percentage of 13C-label measured by 13C MRS (nmol/g tissue) relative to the total concentration measured by 1H MRS, signifying turnover of the metabolite. Values are given as mean±standard deviation. *Significantly different from control group using Student's t-test, P<0.05.

